The Semiconductor Industry Overview, Q4-25
The Spilt Semiconductor Super Cycle

Many of you will know my story and decision to fly solo with Semiconductor Business Intelligence was rooted in frustration. A decade and a half ago, it became obvious to me that the leaders in the semiconductor industry were changing, and so were the stories they were trying to peddle.
Facts and figures became less important than the leaders’ glorified vision of themselves and the extortion gig they would call the “Very Best (Insert Product Here) Company ever.
Data should align with this vision, or it would be considered flawed and rejected. The output dictated the input during strategy sessions, much like the reactor test at Chornobyl.
It was easy to upend the already fragile process of getting good data for the strategy process. Running a semiconductor company was a bit like navigating by the stars, but that was replaced by a Trumpian need to be right, no matter the quagmire the company had got itself into.
Later, it became obvious to me that this was not limited to Semiconductors and their supply network but part of a broader development. Warren Buffett called the company’s financial reports sales documents.
Some of the information is helpful, but most of what Buffett wanted to know was outside the SEC mandate. He wanted to know who was running the business, what they were thinking about it, and what they were doing. Also, he wanted to know about the other companies in the market and what they were doing:
“I cannot understand what one company is doing unless I understand what the other companies in the market are doing.
As a company owner, I want to intelligently evaluate how our managers are performing with regard to the business decisions they make, and I cannot do that without an industry backdrop against which they operate.
There is a great deal of “outside” information that can be used to evaluate a business. The way you learn about a business is by absorbing a lot of information about it and deciding what counts and what does not, and how the information relates to one another. You've got to understand the businesses. This is where it all begins and ends.“
This is one of my aims with Semiconductor Business Intelligence.
My analyses can be used for investment purposes, as the foundation for strategy formation or as a general source of insights into the semiconductor supply chain.
I use the quarter as my temporal unit of analysis, and at the end of every quarter, I provide a status update on the entire semiconductor supply network. This is rarely published in its entirety but is used in my consultancy.
This post represents the Q4-25 update in slide form, which I have used at a series of speaking events. The update will be split into two posts, and my presentation will be attached at the end of the second post.
The Split Semiconductor Supercycle
Most companies in the industry follow the WSTS trade statistics, which are published monthly. The organisation aims to be the most trusted source of trade data in the semiconductor industry. The organisation's members report their shipment data monthly, but there are gaps in WSTS intelligence. Foremost, none of the AI compute companies are members of WSTS, and the variety of business models makes it difficult to define “trade” and “device shipments”. This is becoming more complex as Amazon and Google have also decided to become Semiconductor Device Companies.
Both Apple and Google consume significant amounts of Semiconductor devices for their own products and data centres, but these are not traded on the market and do not have a selling price that makes them comparable to other devices traded in the market.
It is also becoming increasingly difficult to define a device. This AI compute revolution is based on bringing dense stacks of memory dies closer to the processor, which itself is made from two reticle-limited dies, all mounted on silicon interposers and advanced substrates made from layers of Japanese fish packaging film.
Most of Nvidia’s revenue is not limited to these GPU boards but is instead mounted in two-ton, liquid-cooled monsters. Are these devices?
While WSTS does not specify any details about their numbers beyond quantity, revenue, geography, and end market, it is obvious that the Nvidia number is included in the statistics. Another problem is that memory is increasingly sold as mounted on a GPU board, which means there is a risk that it is counted twice. Once, when it was sold to Nvidia, and again, when Nvidia's server system was sold to a hyperscaler.
While I don’t subscribe to right or wrong research – it all depends on the definitions, I generally follow the principle of not including devices that are not traded in the market, like Google and Apple, while including all of NVIDIA’s revenue as semiconductors.
This approach brings me closer to the WSTS numbers and is what I will use in this presentation. I can, however, cut my numbers in any way I find useful for deriving insights, which makes me a contrarian. I do not worry about ”right” or ”wrong” research. What is wrong for one organisation is right for another. I worry about useful research.
The most significant difference between me and WSTS is that they are subscribing to my blog.
While most companies I have worked with are subscribed to the WSTS, I have not seen the data being used for serious strategy work. It is a bit too one-dimensional, as it gives little clue to what really goes on. So companies revert to market research of varying quality, often selected to portray the corporation in a favourable light.
The best use of WSTS data has been to follow the semiconductor cycle. Driven by the two-year investment cycle of semiconductor companies and the boom-bust memory pricing, the Semiconductor market has followed a 4-year cycle of a few quarters’ sharp downturn and a longer climb to the next peak.
Not even the dot-com crash, COVID, or the financial crisis has managed to disrupt the cycle. That is up until now.
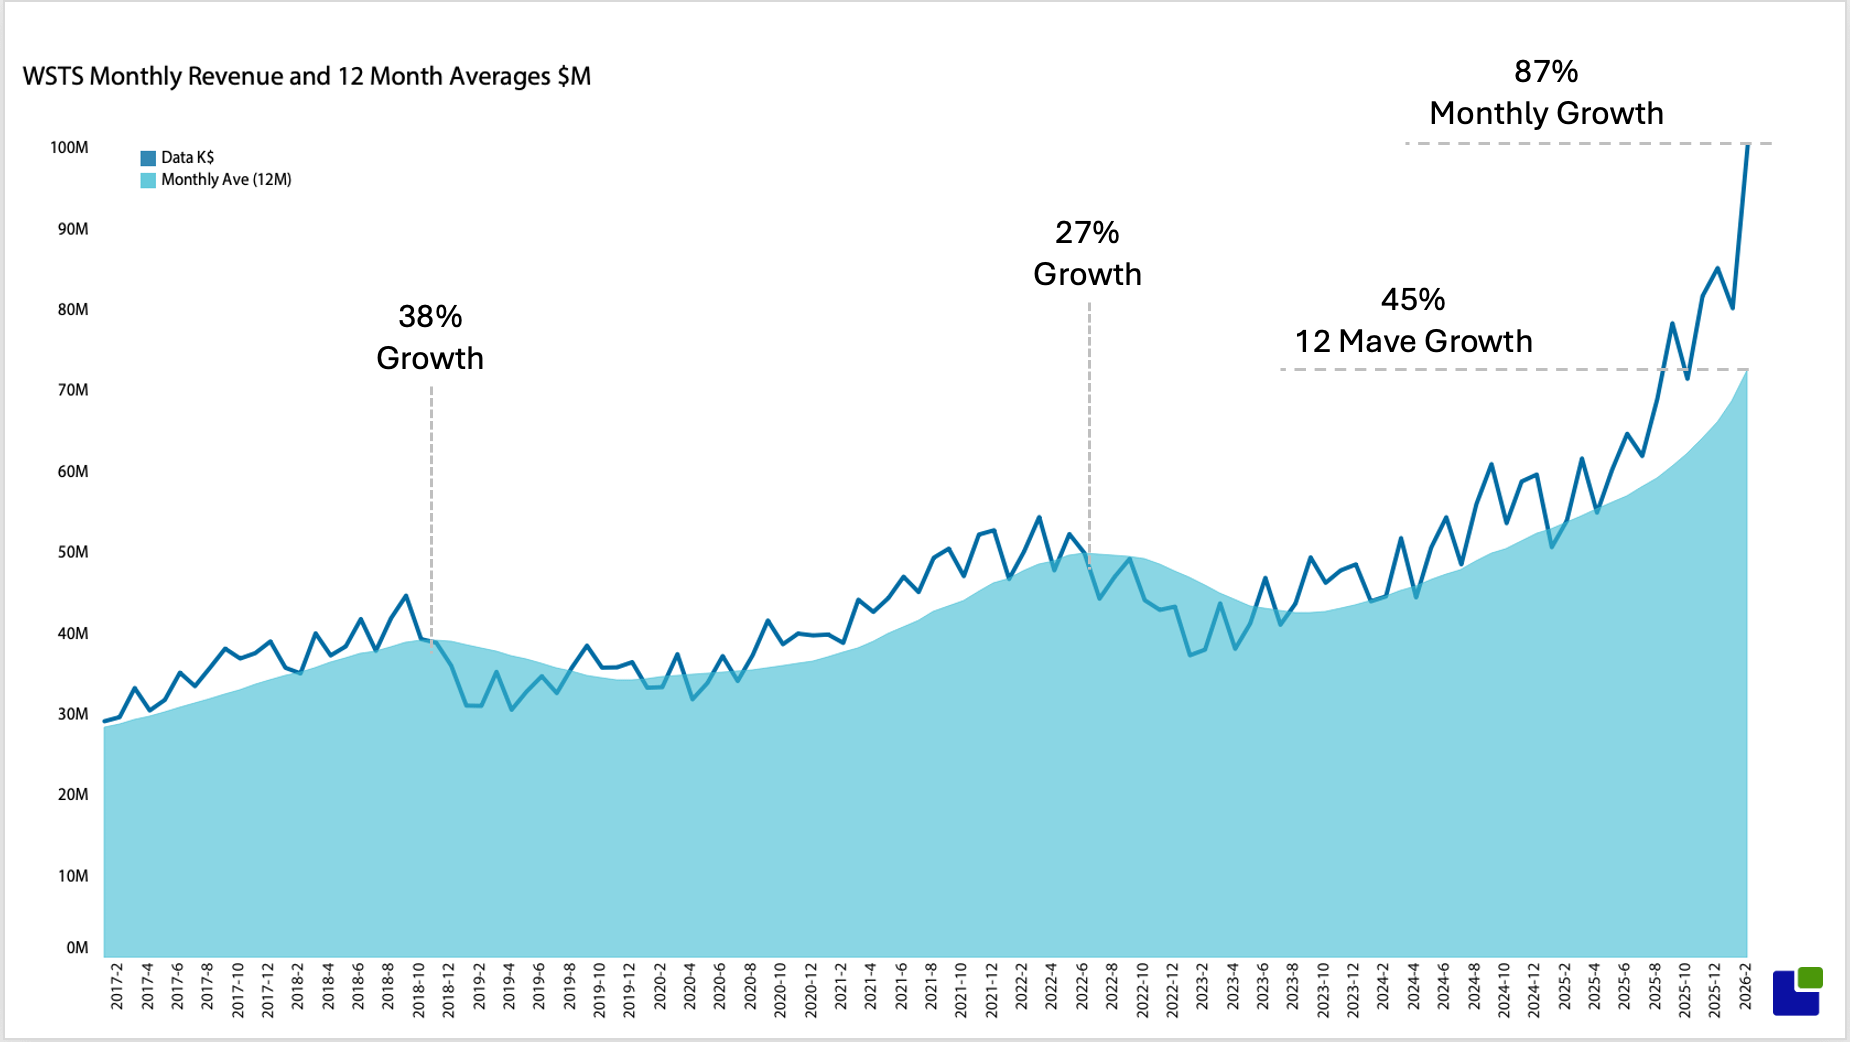
The numbers show include the feb numbers. A February that has been incredibly strong and 87% higher than last February. Also, the monthly averages reveal this is an unusually strong cycle, which is not surprising given the current AI boom.
While LLMs existed before, the Semiconductor AI boom began in the third quarter of 23, when Nvidia delivered its first H100 quarter. A couple of years later, the AI boom is still going strong and is likely to continue.
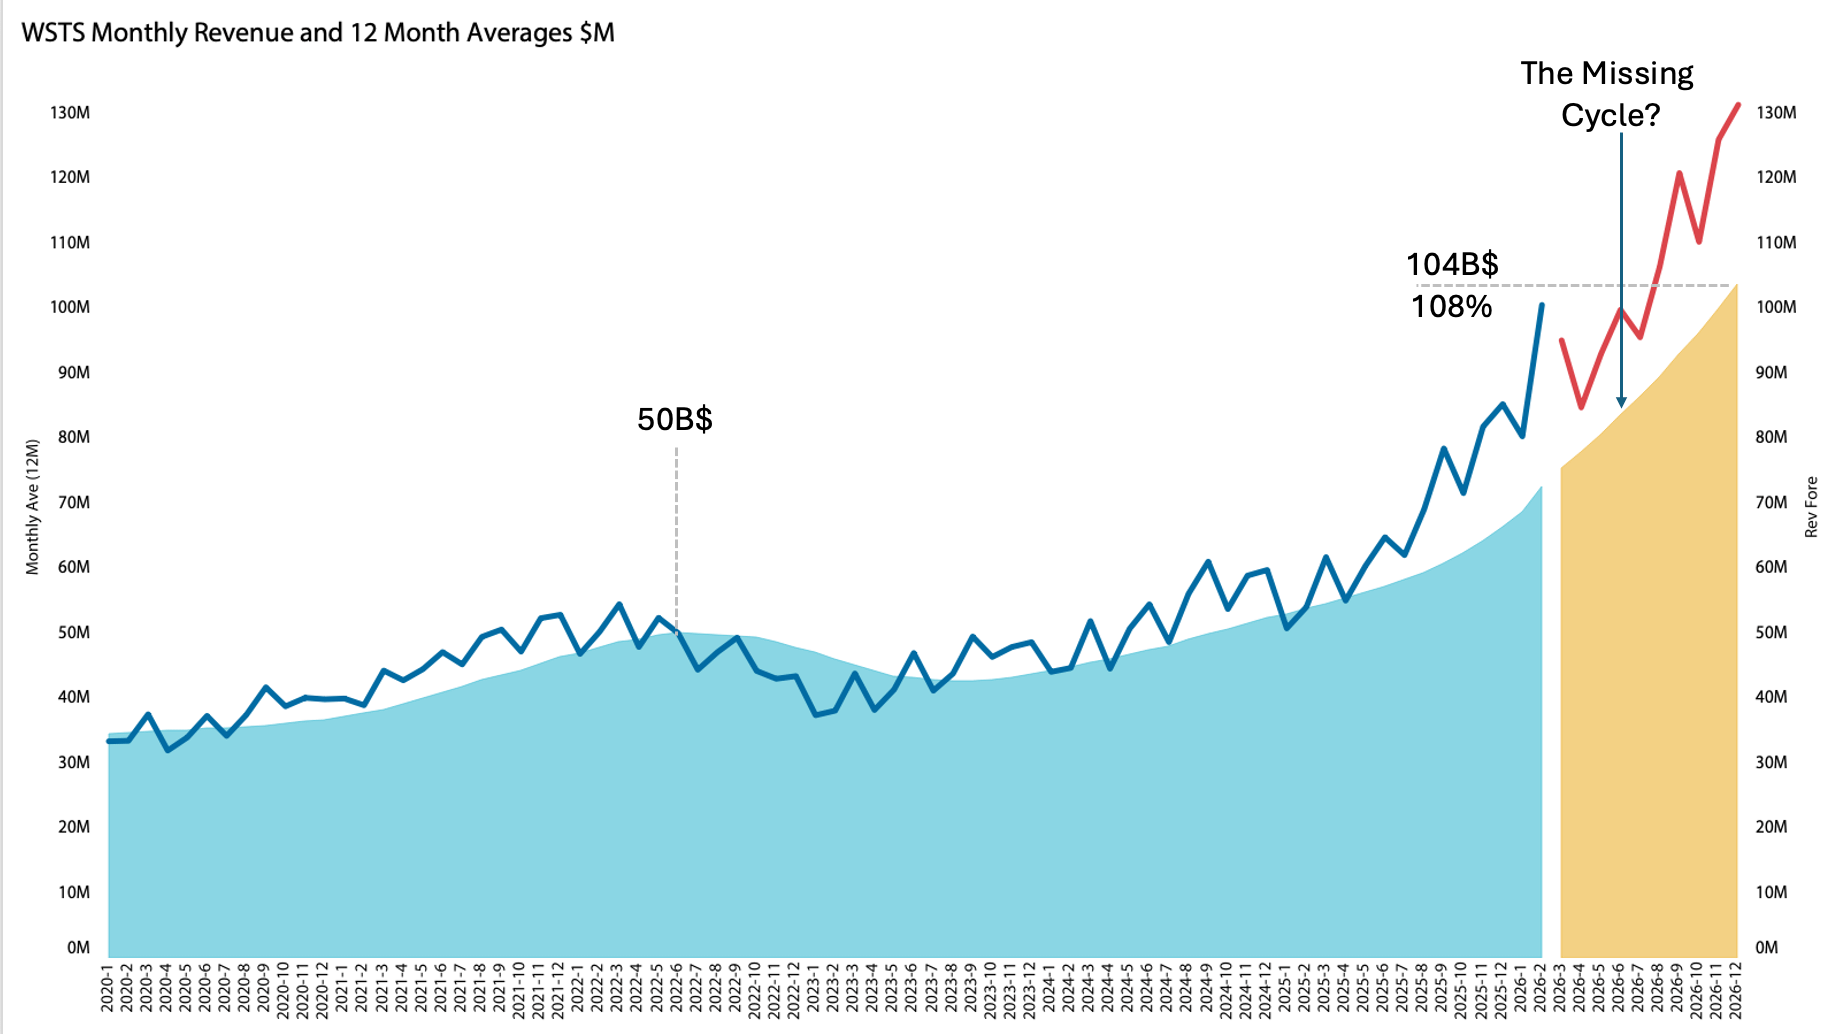
The forecast shows that the AI boom will continue into the next cycle, which was expected to happen in mid-2026, but according to WSTS, this will not happen.
WSTS expect the market to reach a monthly average of 104M$ or 108% above the last peak. This is not your grandmother’s cycle for sure.
Apart from WSTS, there are other self-proclaimed oracles that pride themselves on accurately predicting annual semiconductor revenue. While quite interesting, it is not very useful to develop strategic responses.
For that, more detail is needed.
The Semiconductor industry is highly dependent on an intricate, increasingly complex supply chain. It all begins with silicon sand melted and extruded into a massive boulder with a perfect crystallising structure, then sawn into silicon wafers with diamond saws. Light and magic tools from AMSL, along with single-atom-manipulating tools from AMAT, pry out the semiconductor devices, cut them, and package them.
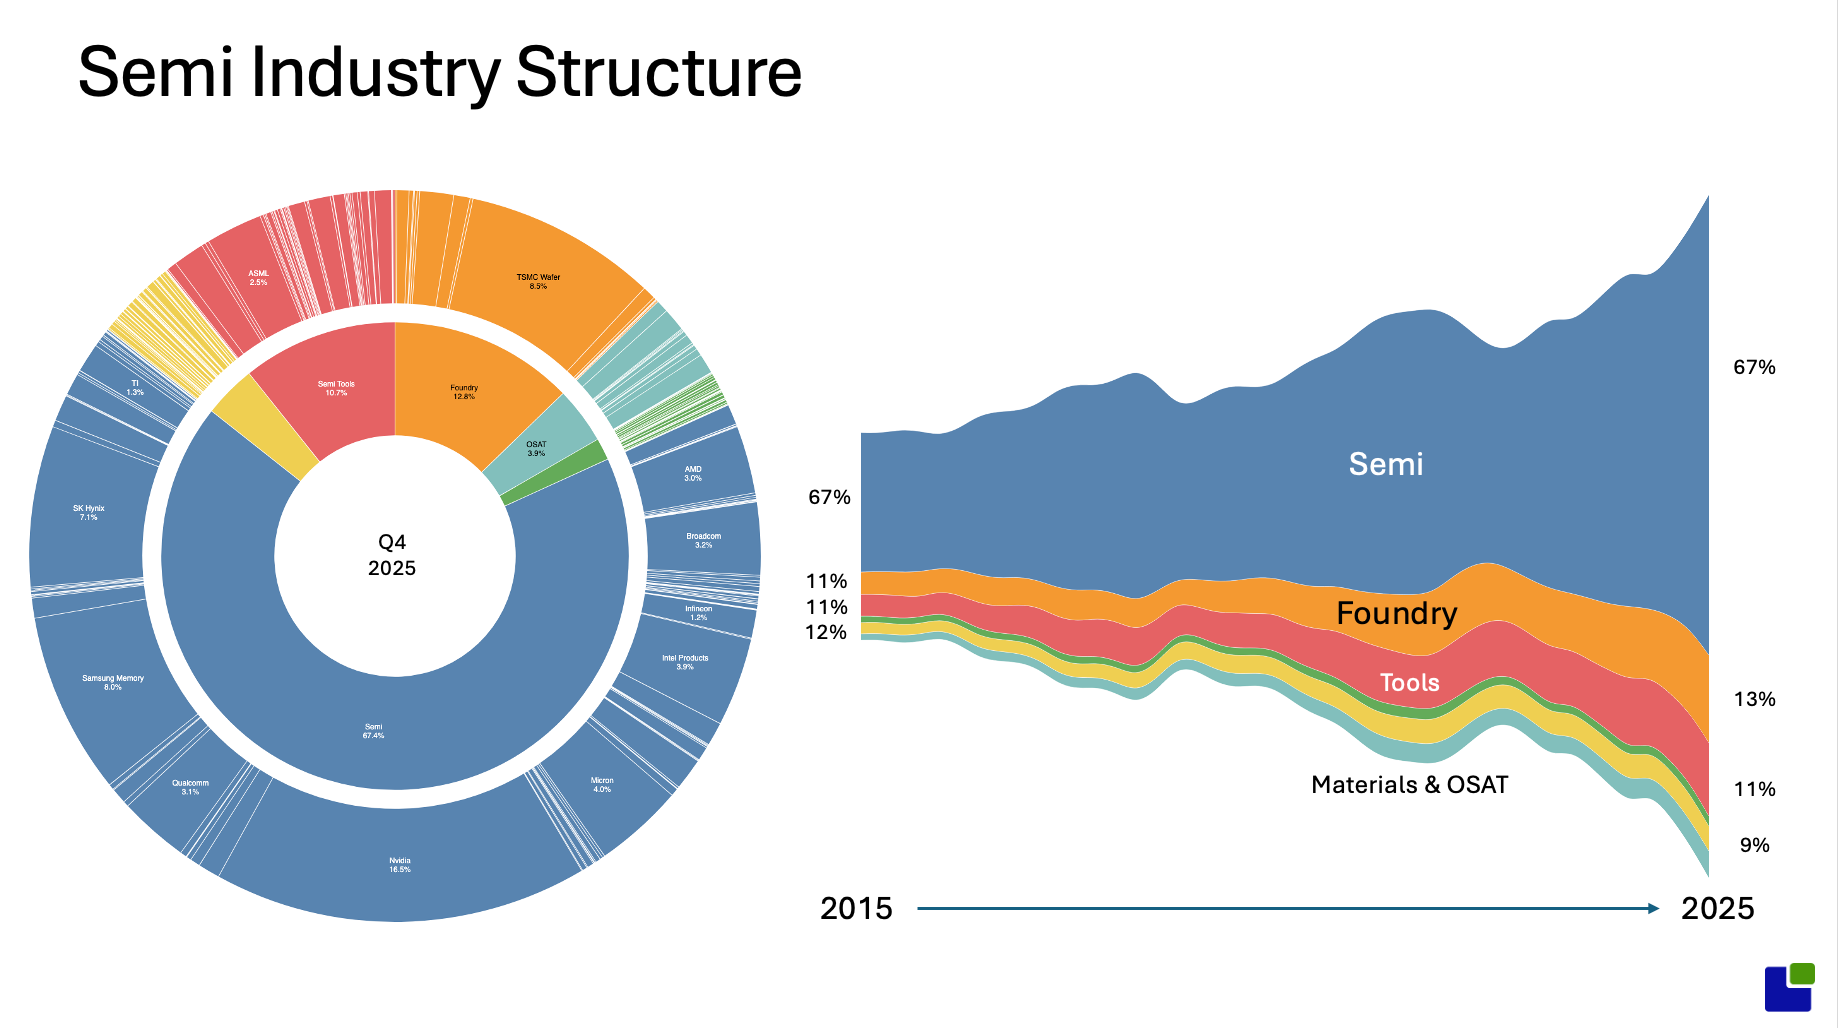
The 5 most important areas of the supply chain are shown in the chart. While the Semiconductor and tool markets have been pretty stable, the foundry market has been increasing its share.
The most important observation is that the materials and OSAT have declined in share over time. More has been made with less.
The outer ring also shows the dominance of certain companies in each sector. NVIDIA, TSMC and ASML are very visible.
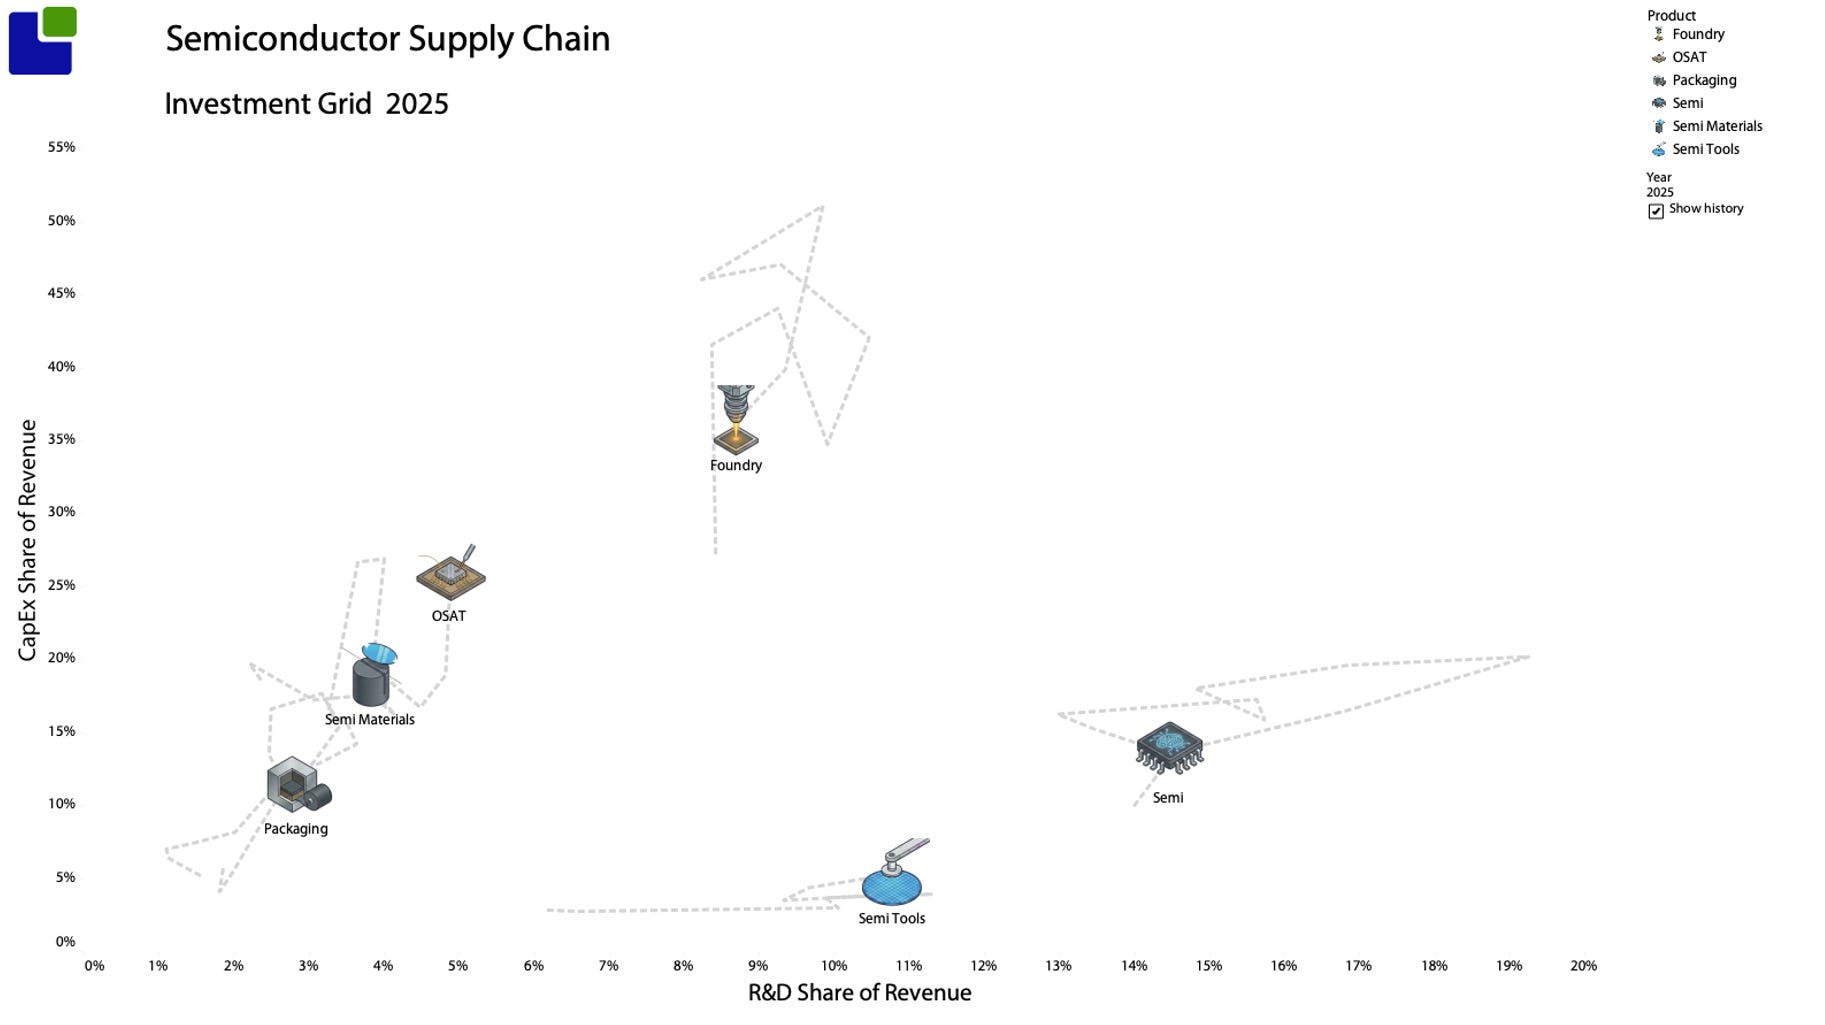
Each part of the supply chain has an individual investment section they occupy in the Investment grid
The grid shows the share of revenue allocated to CapEx and R&D.
The chart is shown for 2025 with the trails showing the location over the last few years.
While Semiconductor R&D approached 20%, Nvidia's rise has pushed the share back to 15%, and CapEx has also been more stable, around 15%.
Foundry investments have also declined from above 50% to now being around 35% - this is somewhat counterintuitive given the current industry narrative of hyper growth and shortages – I will investigate this in more detail later.
The development in tools is a move towards more R&D rather than more manufacturing capacity. This is a common misconception about tools like the advanced lithography tools. It is not only about achieving a specific technical detail but also about doing so at high throughput. While expensive, high-NA tools need to be economically viable.
Packaging and semiconductor materials, along with OSAT, are moving to higher investment levels, demonstrating that everything is becoming more advanced, not just manufacturing.
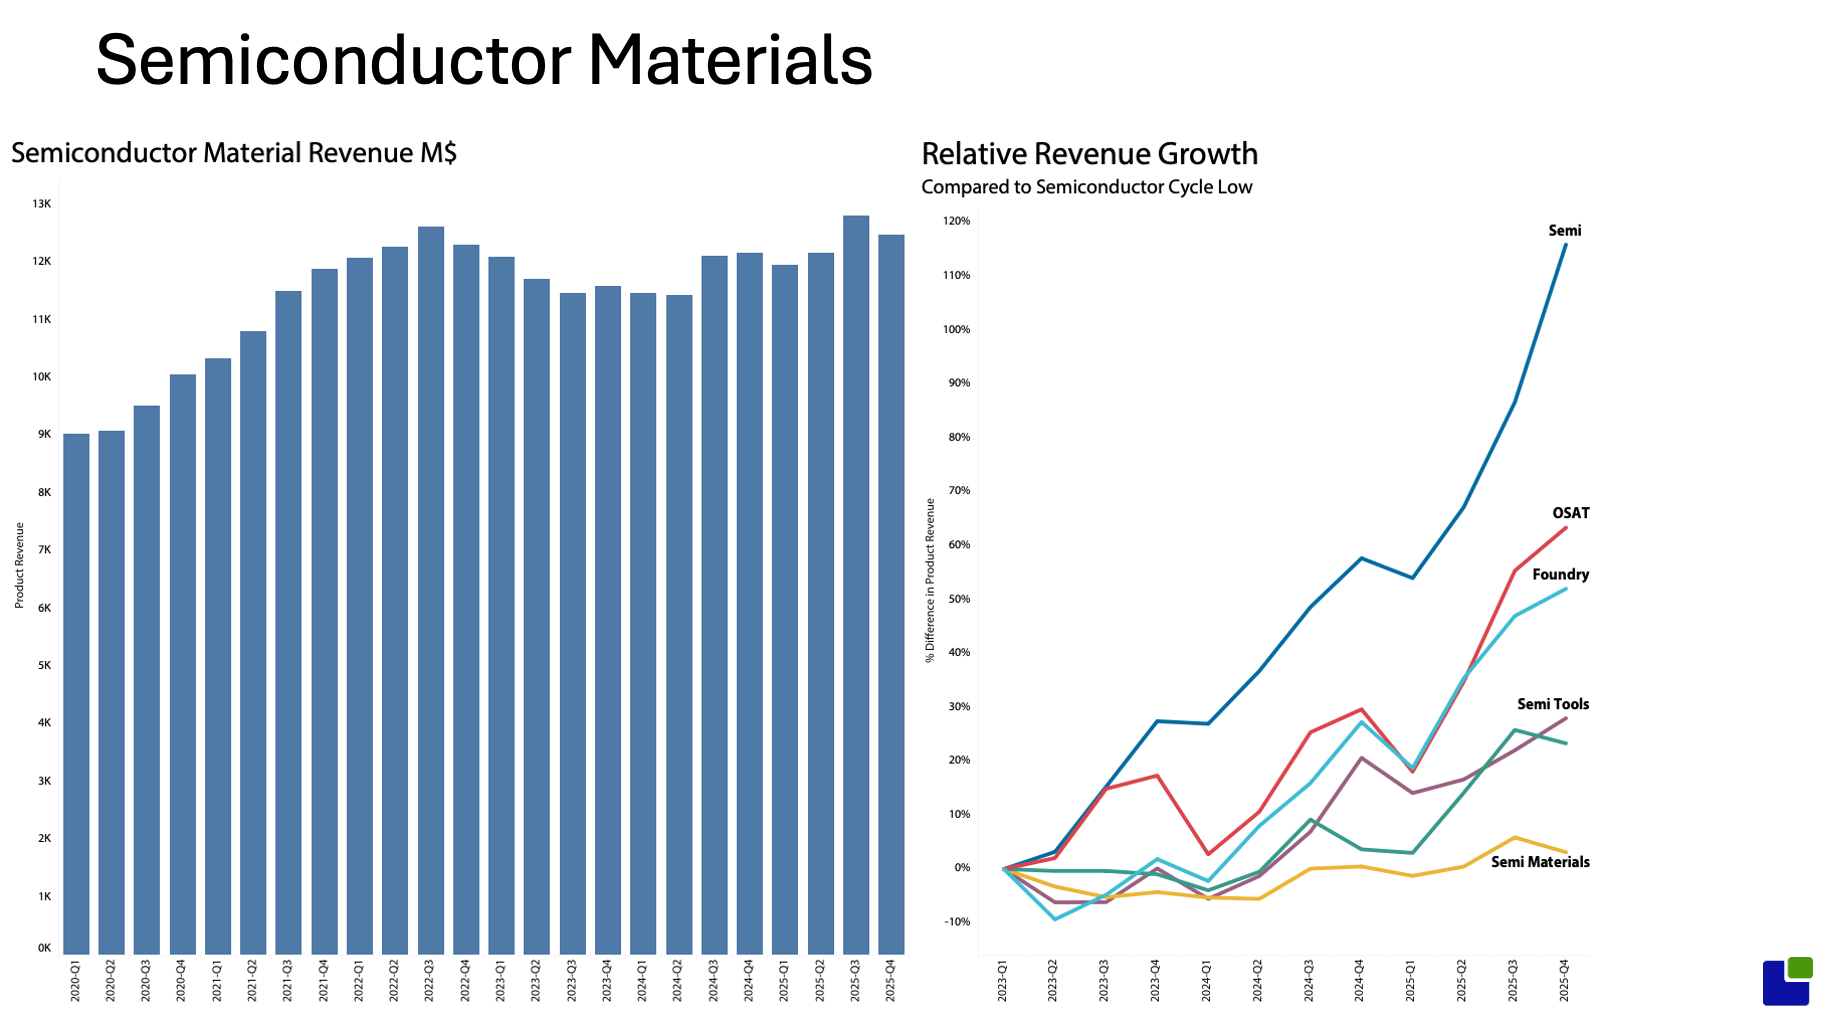
While the long-term share of supply chain revenue has been similar, except for materials, since 2015, developments since the downcycle low reveal significant differences. Semiconductor revenue has grown significantly, as has that of foundry and OSAT. The industry is changing.
This is really the conundrum of this semiconductor cycle. Growth without any nutrition for the lowest part of the semiconductor supply network. While revenue is slightly down compared to the last peak, the COGS suggest that shipments are up aproximately 7% from the last peak. This is still very hard to reconcile with Semiconductor growth. From the bottom, growth is 3% versus 116% for semiconductors.
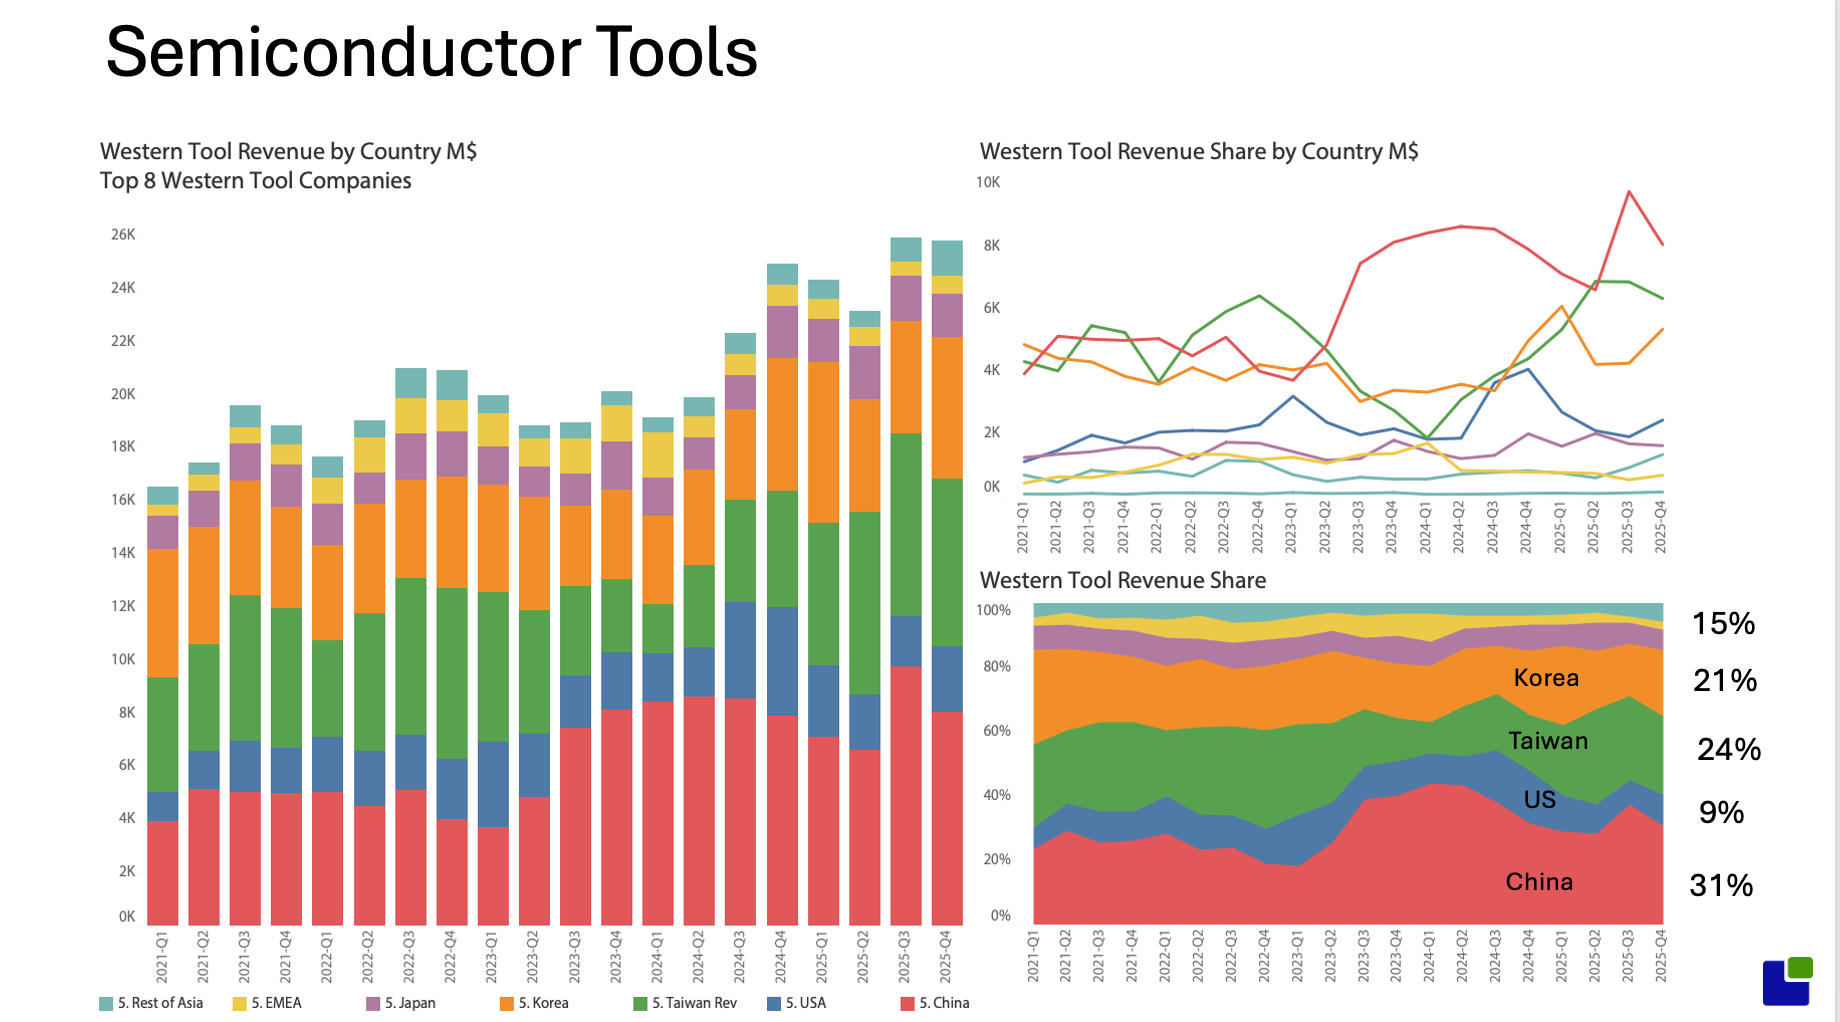
The semiconductor tool sales that normally follow the semiconductor industry did not take a dive in the downcycle. The generally accepted narrative was that the CHIPS Act ended the downcycle as semiconductor companies sought to fill their US fabs.
The charts tell a different story. It was China that prevented the market from falling. As the US increasingly imposed embargoes on Chinese companies, Chinese Semiconductor companies responded by buying many more tools.
Embargoes never work as intended, but they do have an impact.
Excluding the Chinese revenue shows the cycle was indeed there and reveals a two-year investment void.
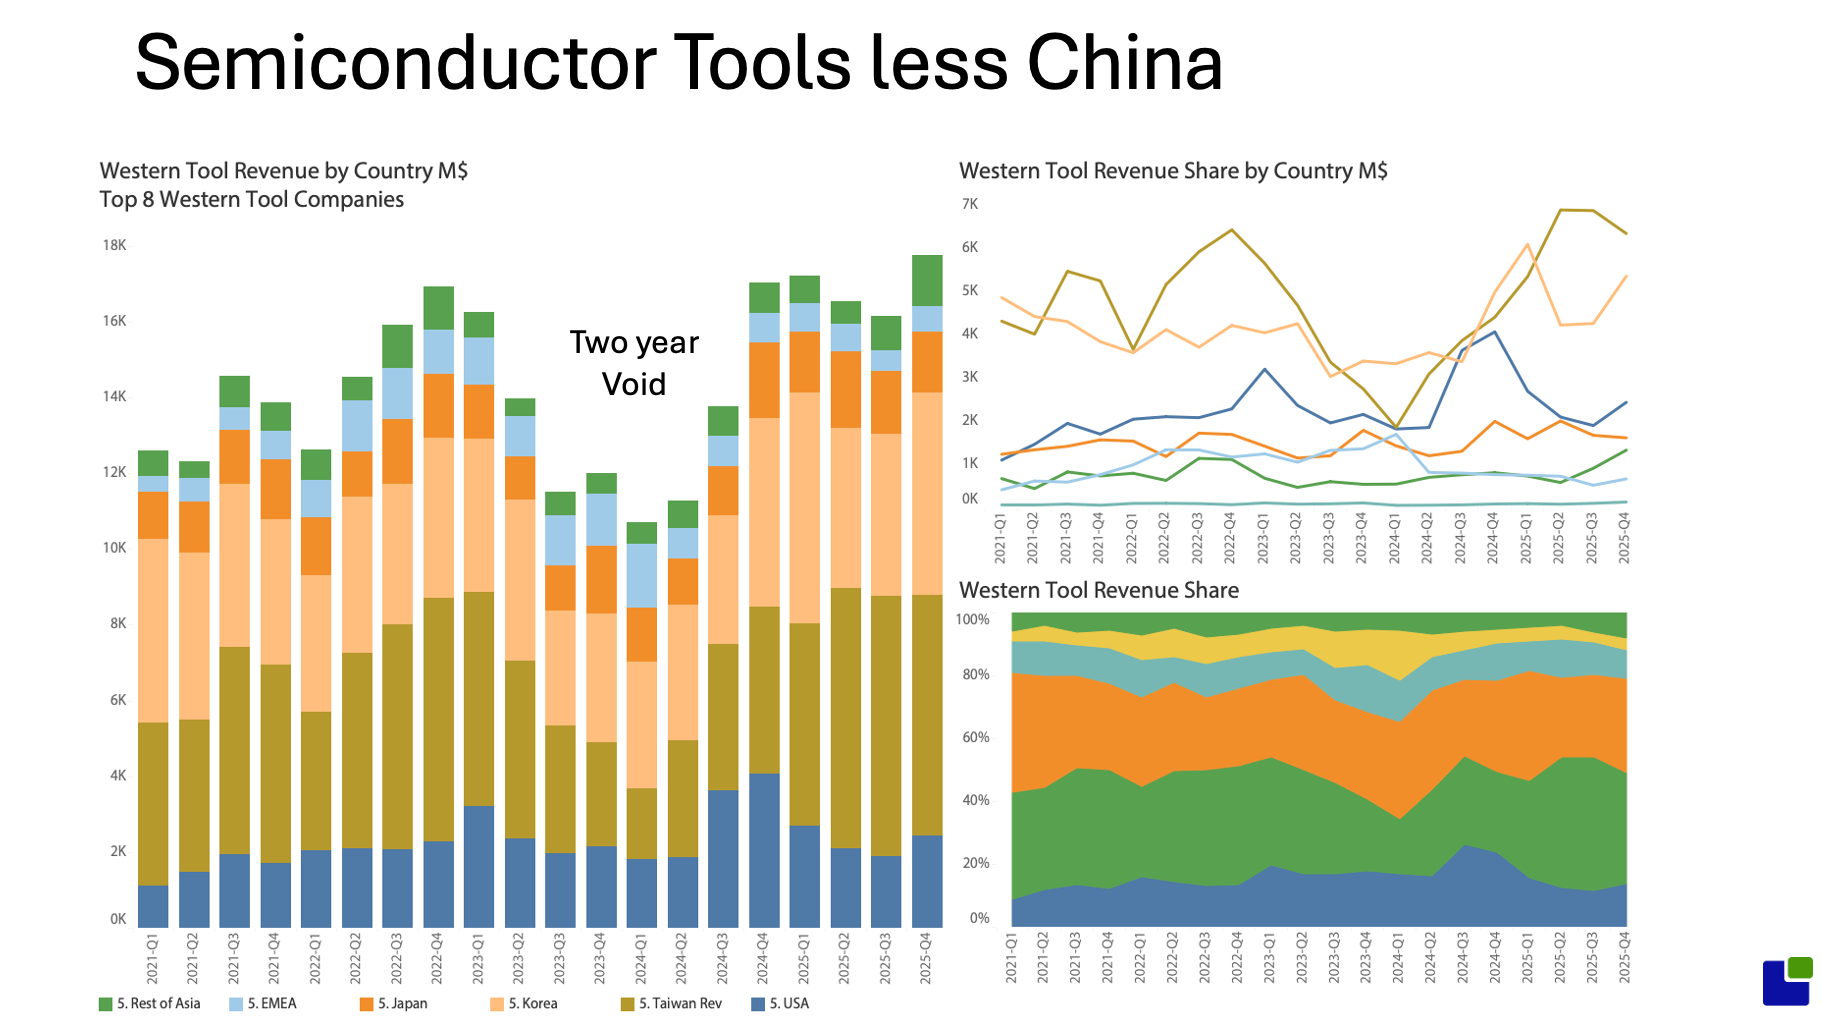
Prominently were the Korean tool sales. While they were the highest outside China, they took a dive. Taiwan's revenue declined but has recovered to earlier levels, while Korean tool sales are still flipping.
This is one of the reasons that we have the current skyrocketing prices on memory. More on that later.
The packaging industry is undergoing dramatic change and is the second-fastest-growing area in the semiconductor supply chain.
This AI revolution is really built on packaging rather than leading-edge node development. All of Nvidia’s revenue to date has been generated on TSMC's 4nm node.
The performance gains have been achieved by joining two reticle-limited GPUs, stacking high-bandwidth memory very closely together, and adding numerous memory connections.
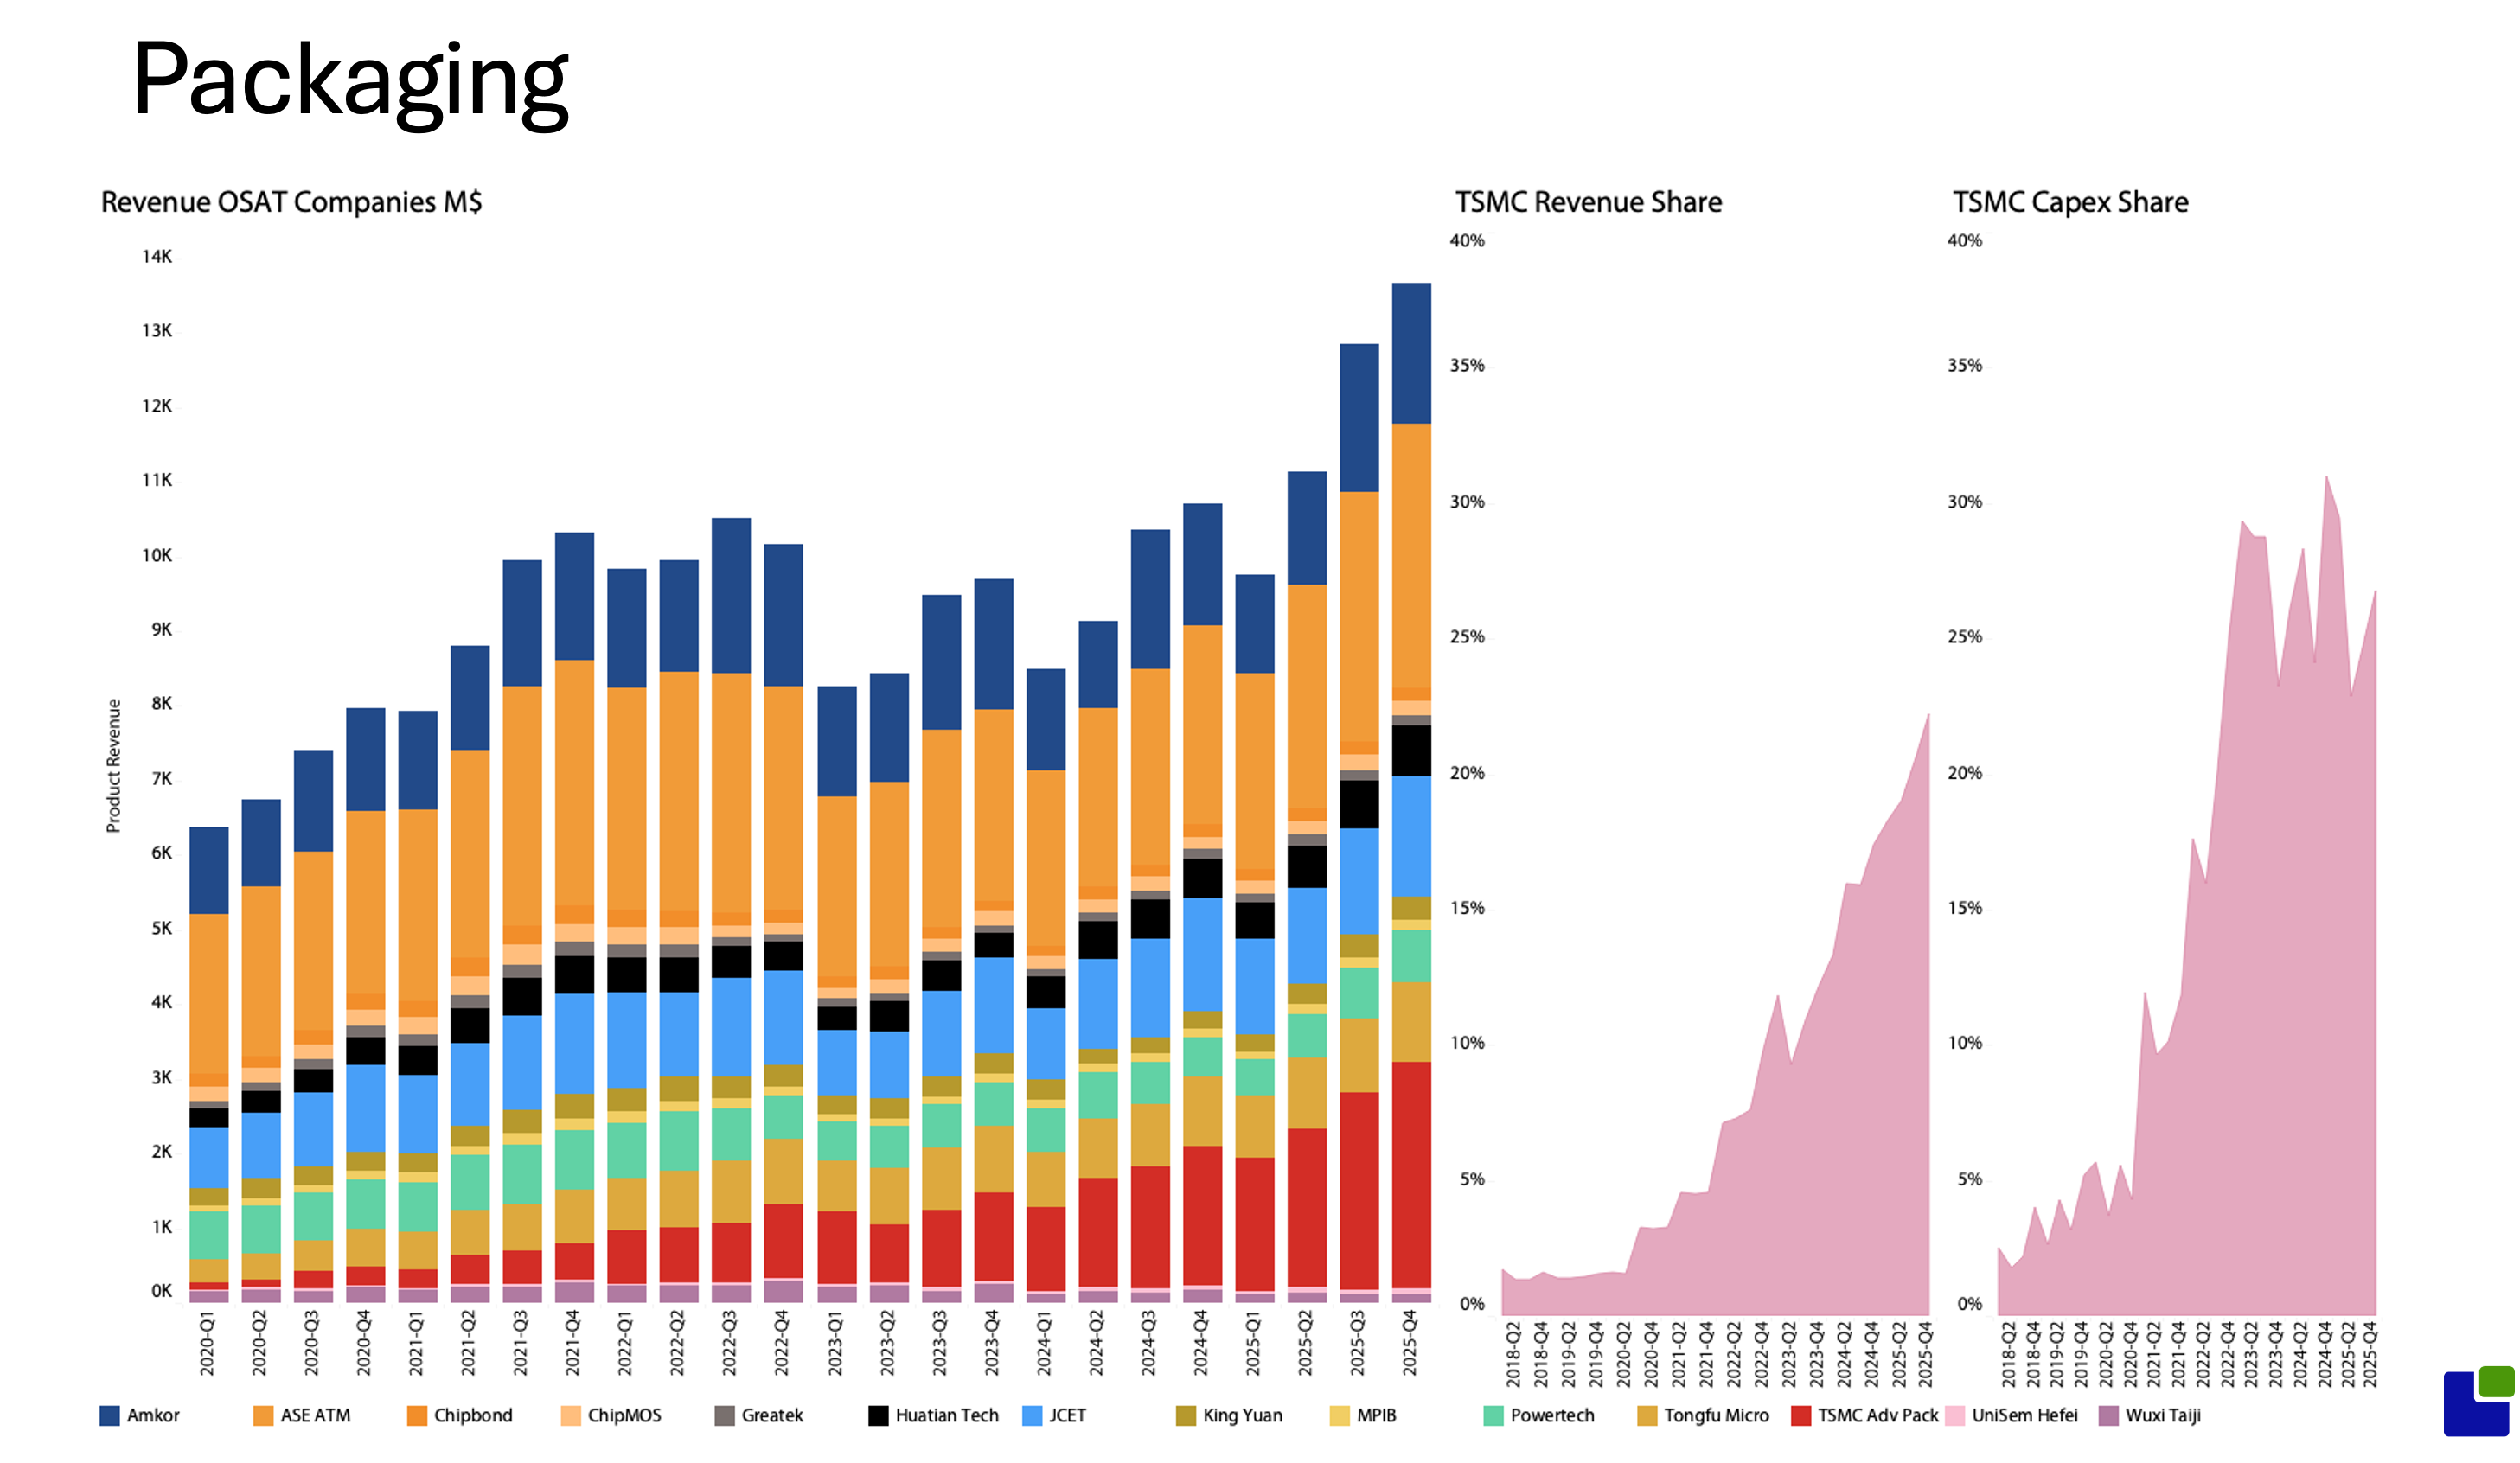
For TSMC, this was both an opportunity to broaden its revenue base and a way of “lowering” its market share by combining the foundry and OSAT markets into what they called The Foundry 2.0 strategy.
Within a short while, TSMC accounted for 30% of the CapEx in the OSAT market, and its revenue is well on its way to intercepting.
The OSAT industry is rapidly changing from low-cost, labour-intensive sweatshops to leading-edge, high-tech companies with increasing R&D budgets.
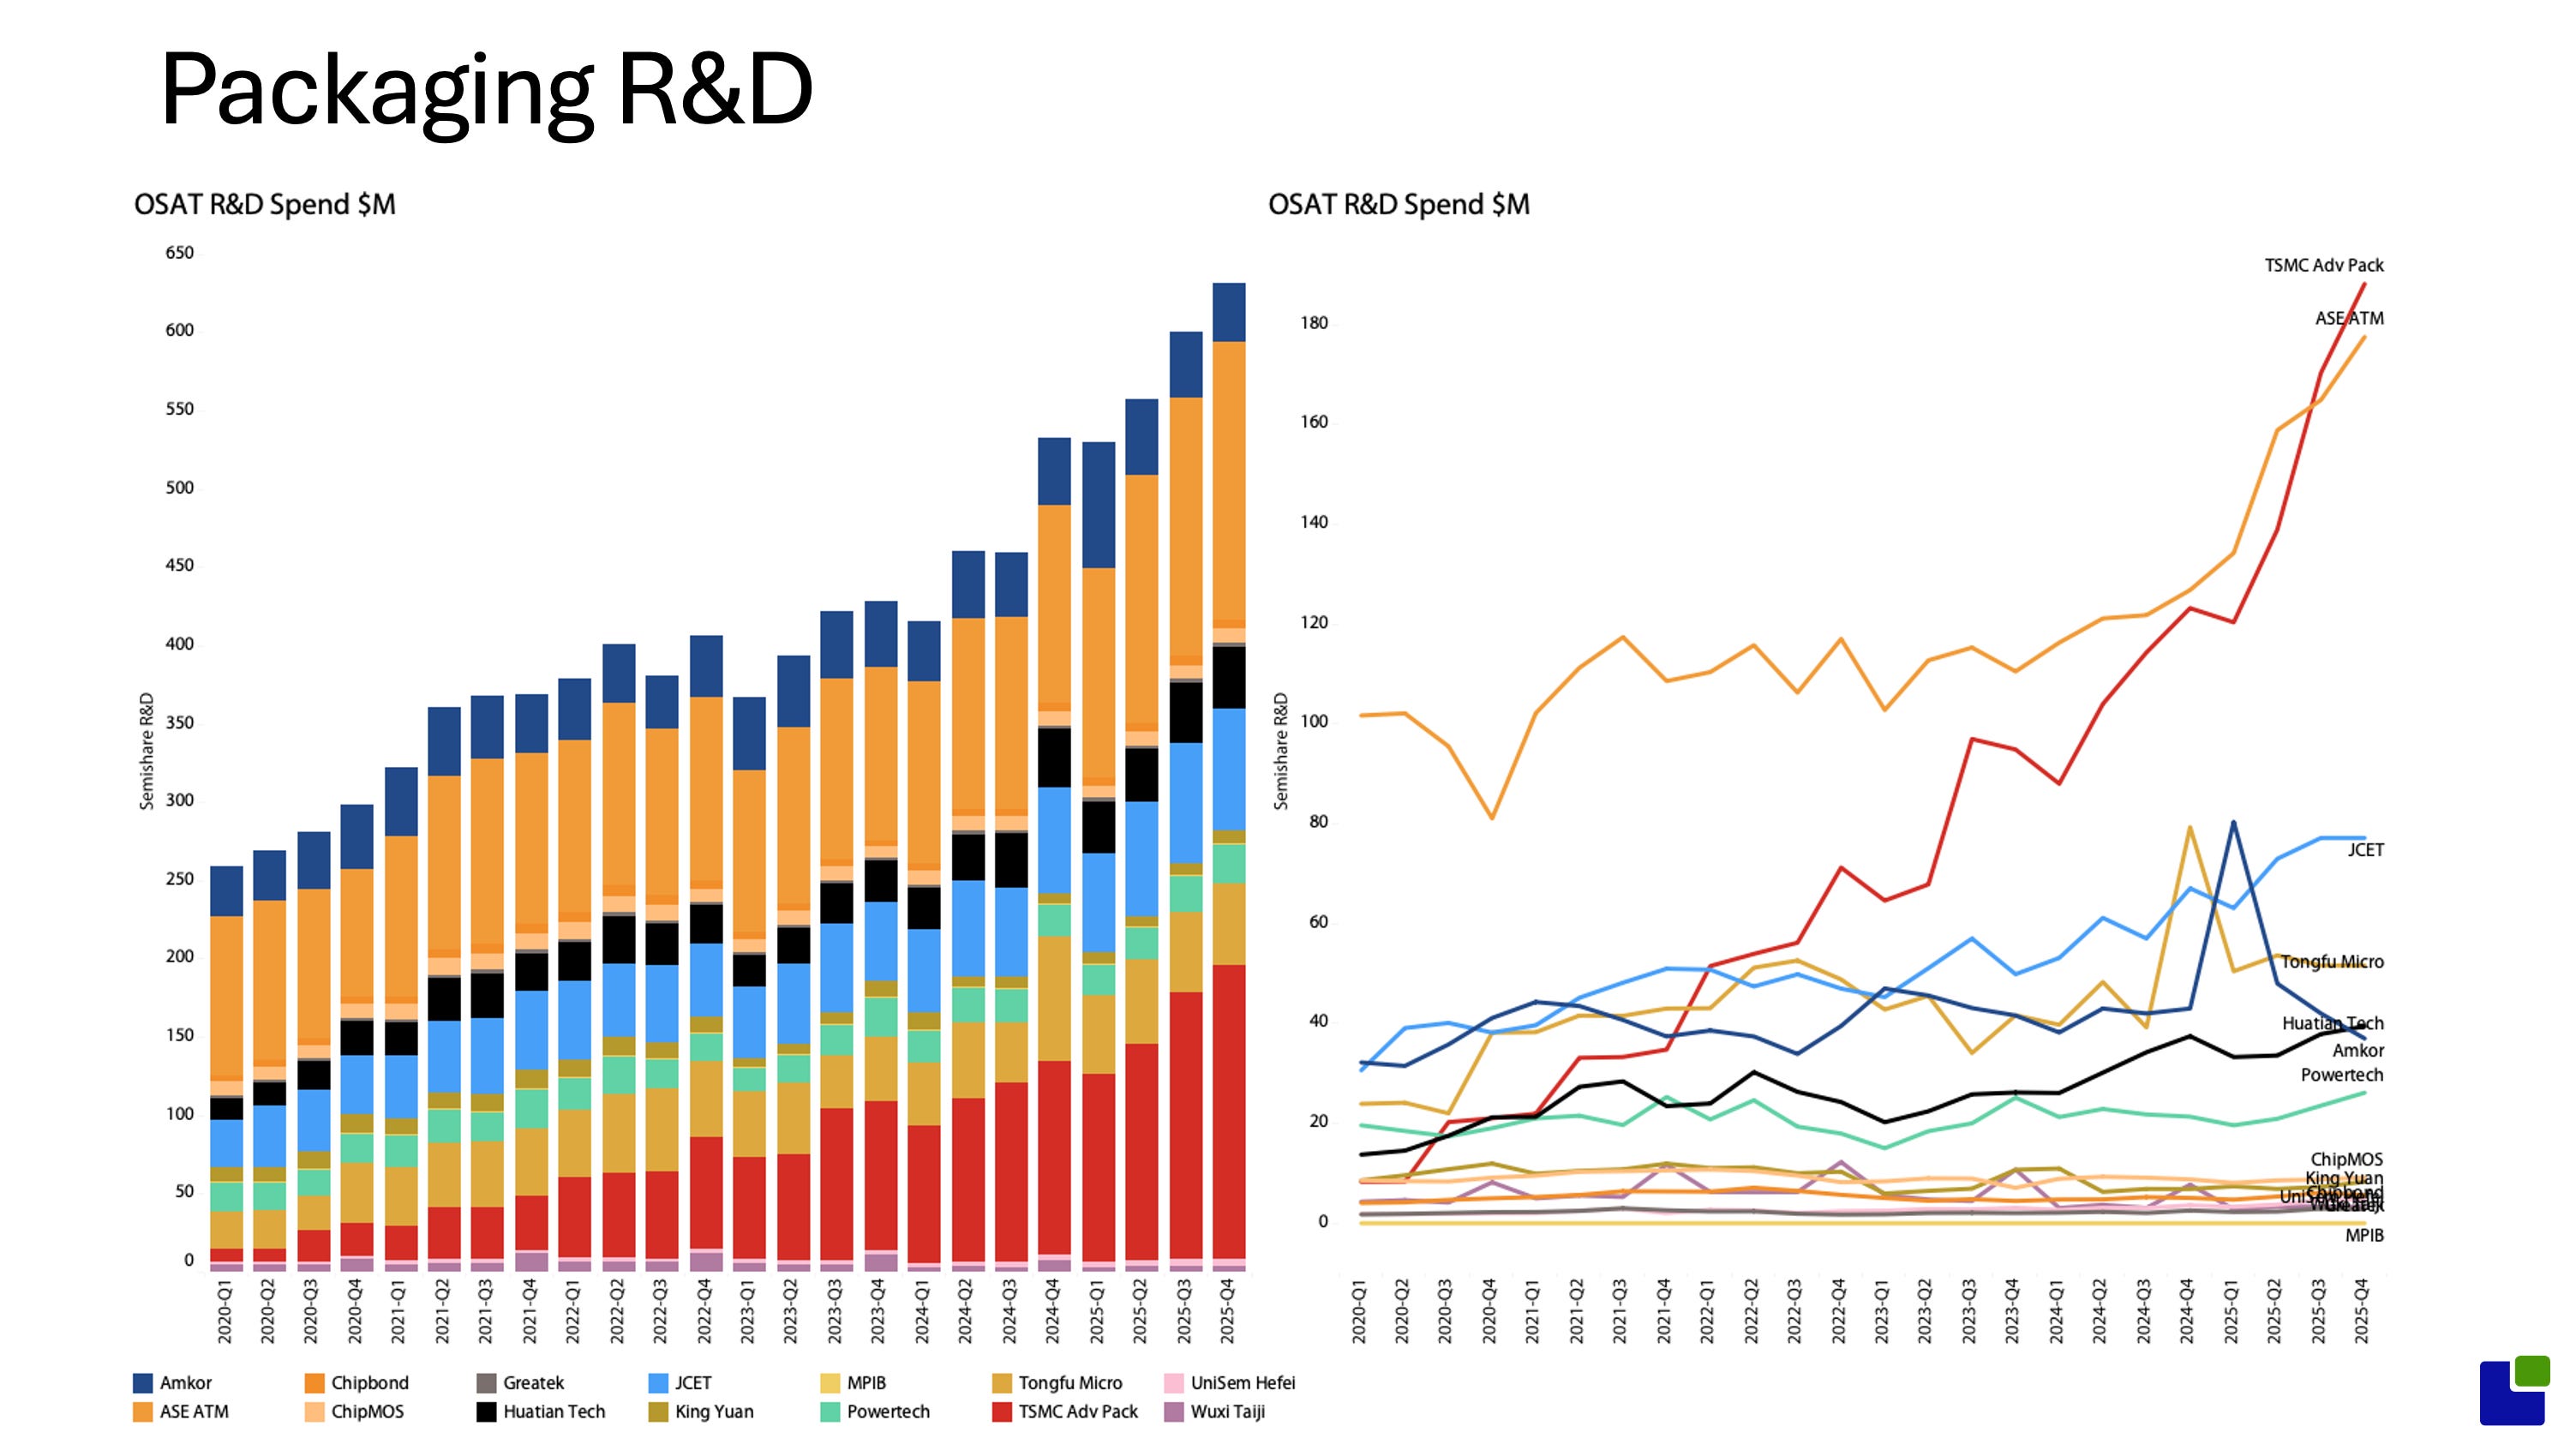
ASE Technology of Taiwan was not late to join TSMC in the arms race, and the two companies will own the future, while Amkor of the US has yet to make a significant move.
While this also runs counter to the narrative that the US is bringing Semiconductors home, supply chain investments are largely absent, and when they are made, they are mostly by foreign companies.
They are just as American as a Toyota Camry built in Kentucky.
There is no doubt that the US capacity will eventually be significant, but it is inherently foreign.
The Foundry market grew almost as fast as OSAT and, unsurprisingly, is dominated by TSMC.
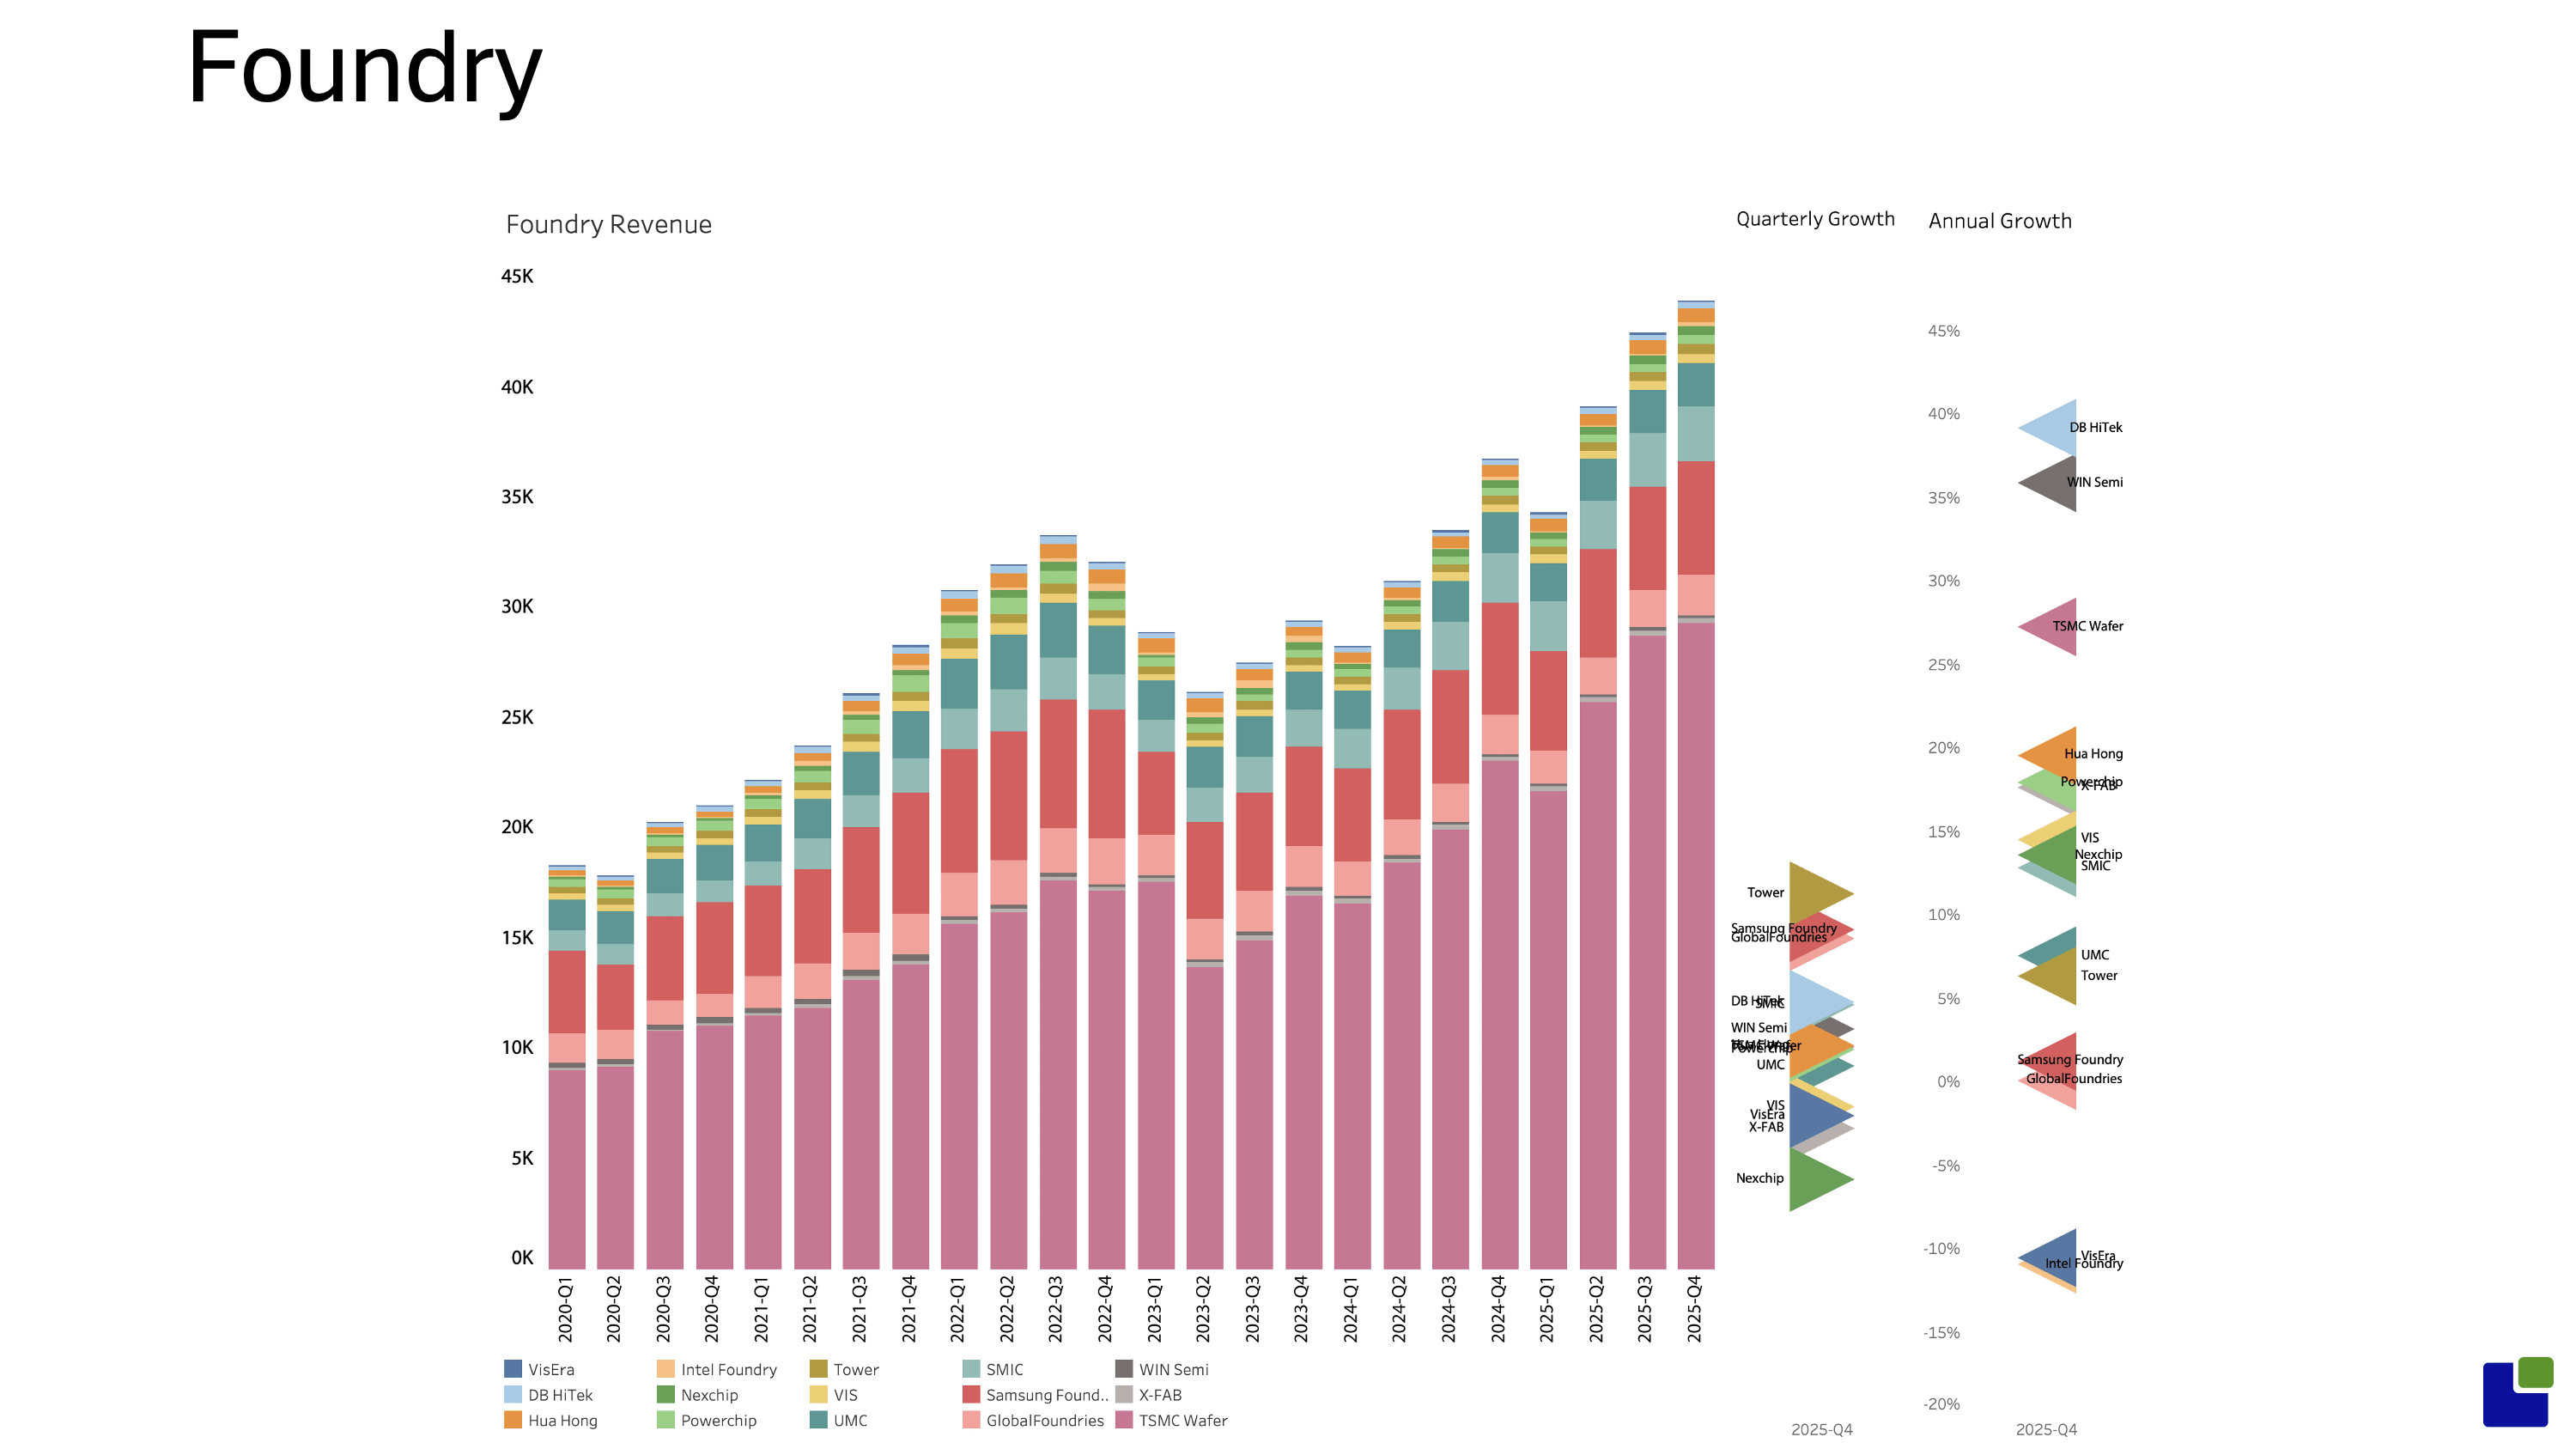
What is more surprising is that TSMC is not the foundry with the fastest growth. This is quite surprising given the demand pressure on TSMC's leading-edge nodes, but the Taiwanese wizards are following the playbook of quasi-monopolistic companies: increasing capacity too fast limits the strategic pricing power that a monopoly affords.
TSMC is not promoting this strategy because it can anger customers, but the reality is that TSMC is not adding capacity when measured in 12-inch-equivalent wafers, and it is not planning to do so over the next year.
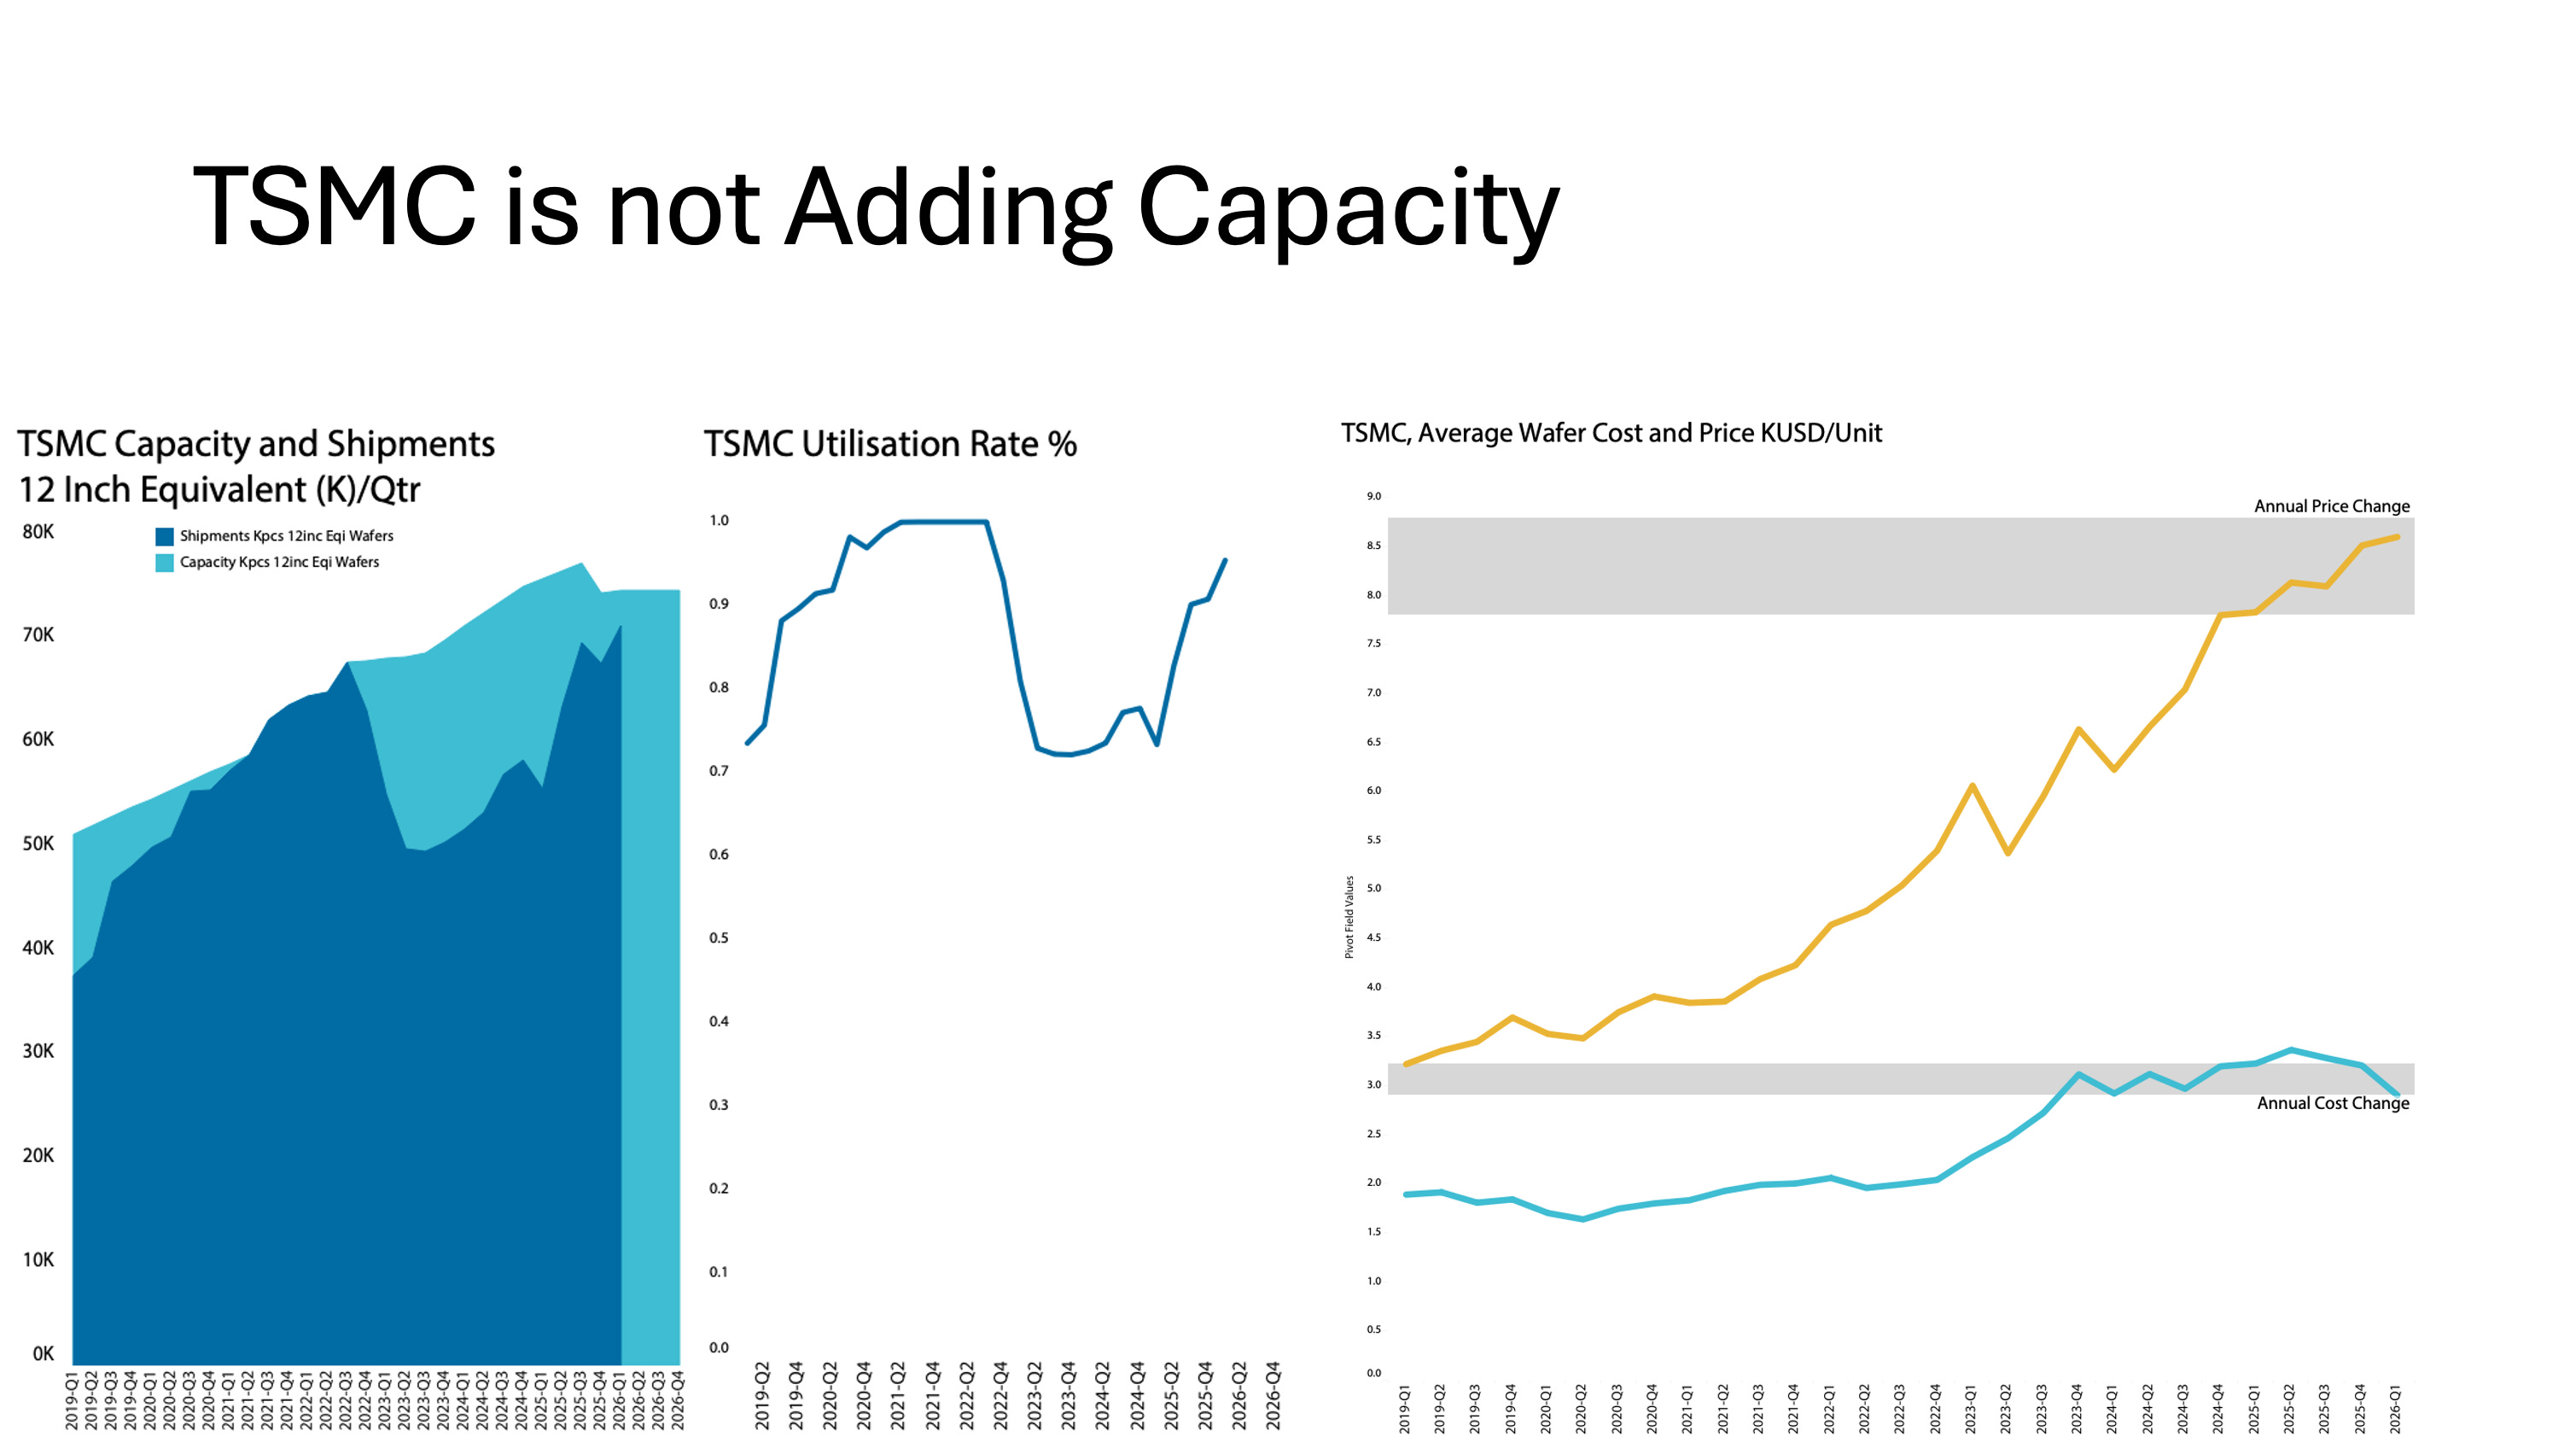
I am not saying that TSMC is not trying to get as much 2- and 3-nm capacity as possible, but they are, at the same time, phasing out older, higher-cost technologies.
Interestingly, this financially sound strategy is reducing overall wafer costs even as prices continue to rise.
TSMC is calmly executing its long-term, controlled strategy while everyone else is running around with their hair on fire.
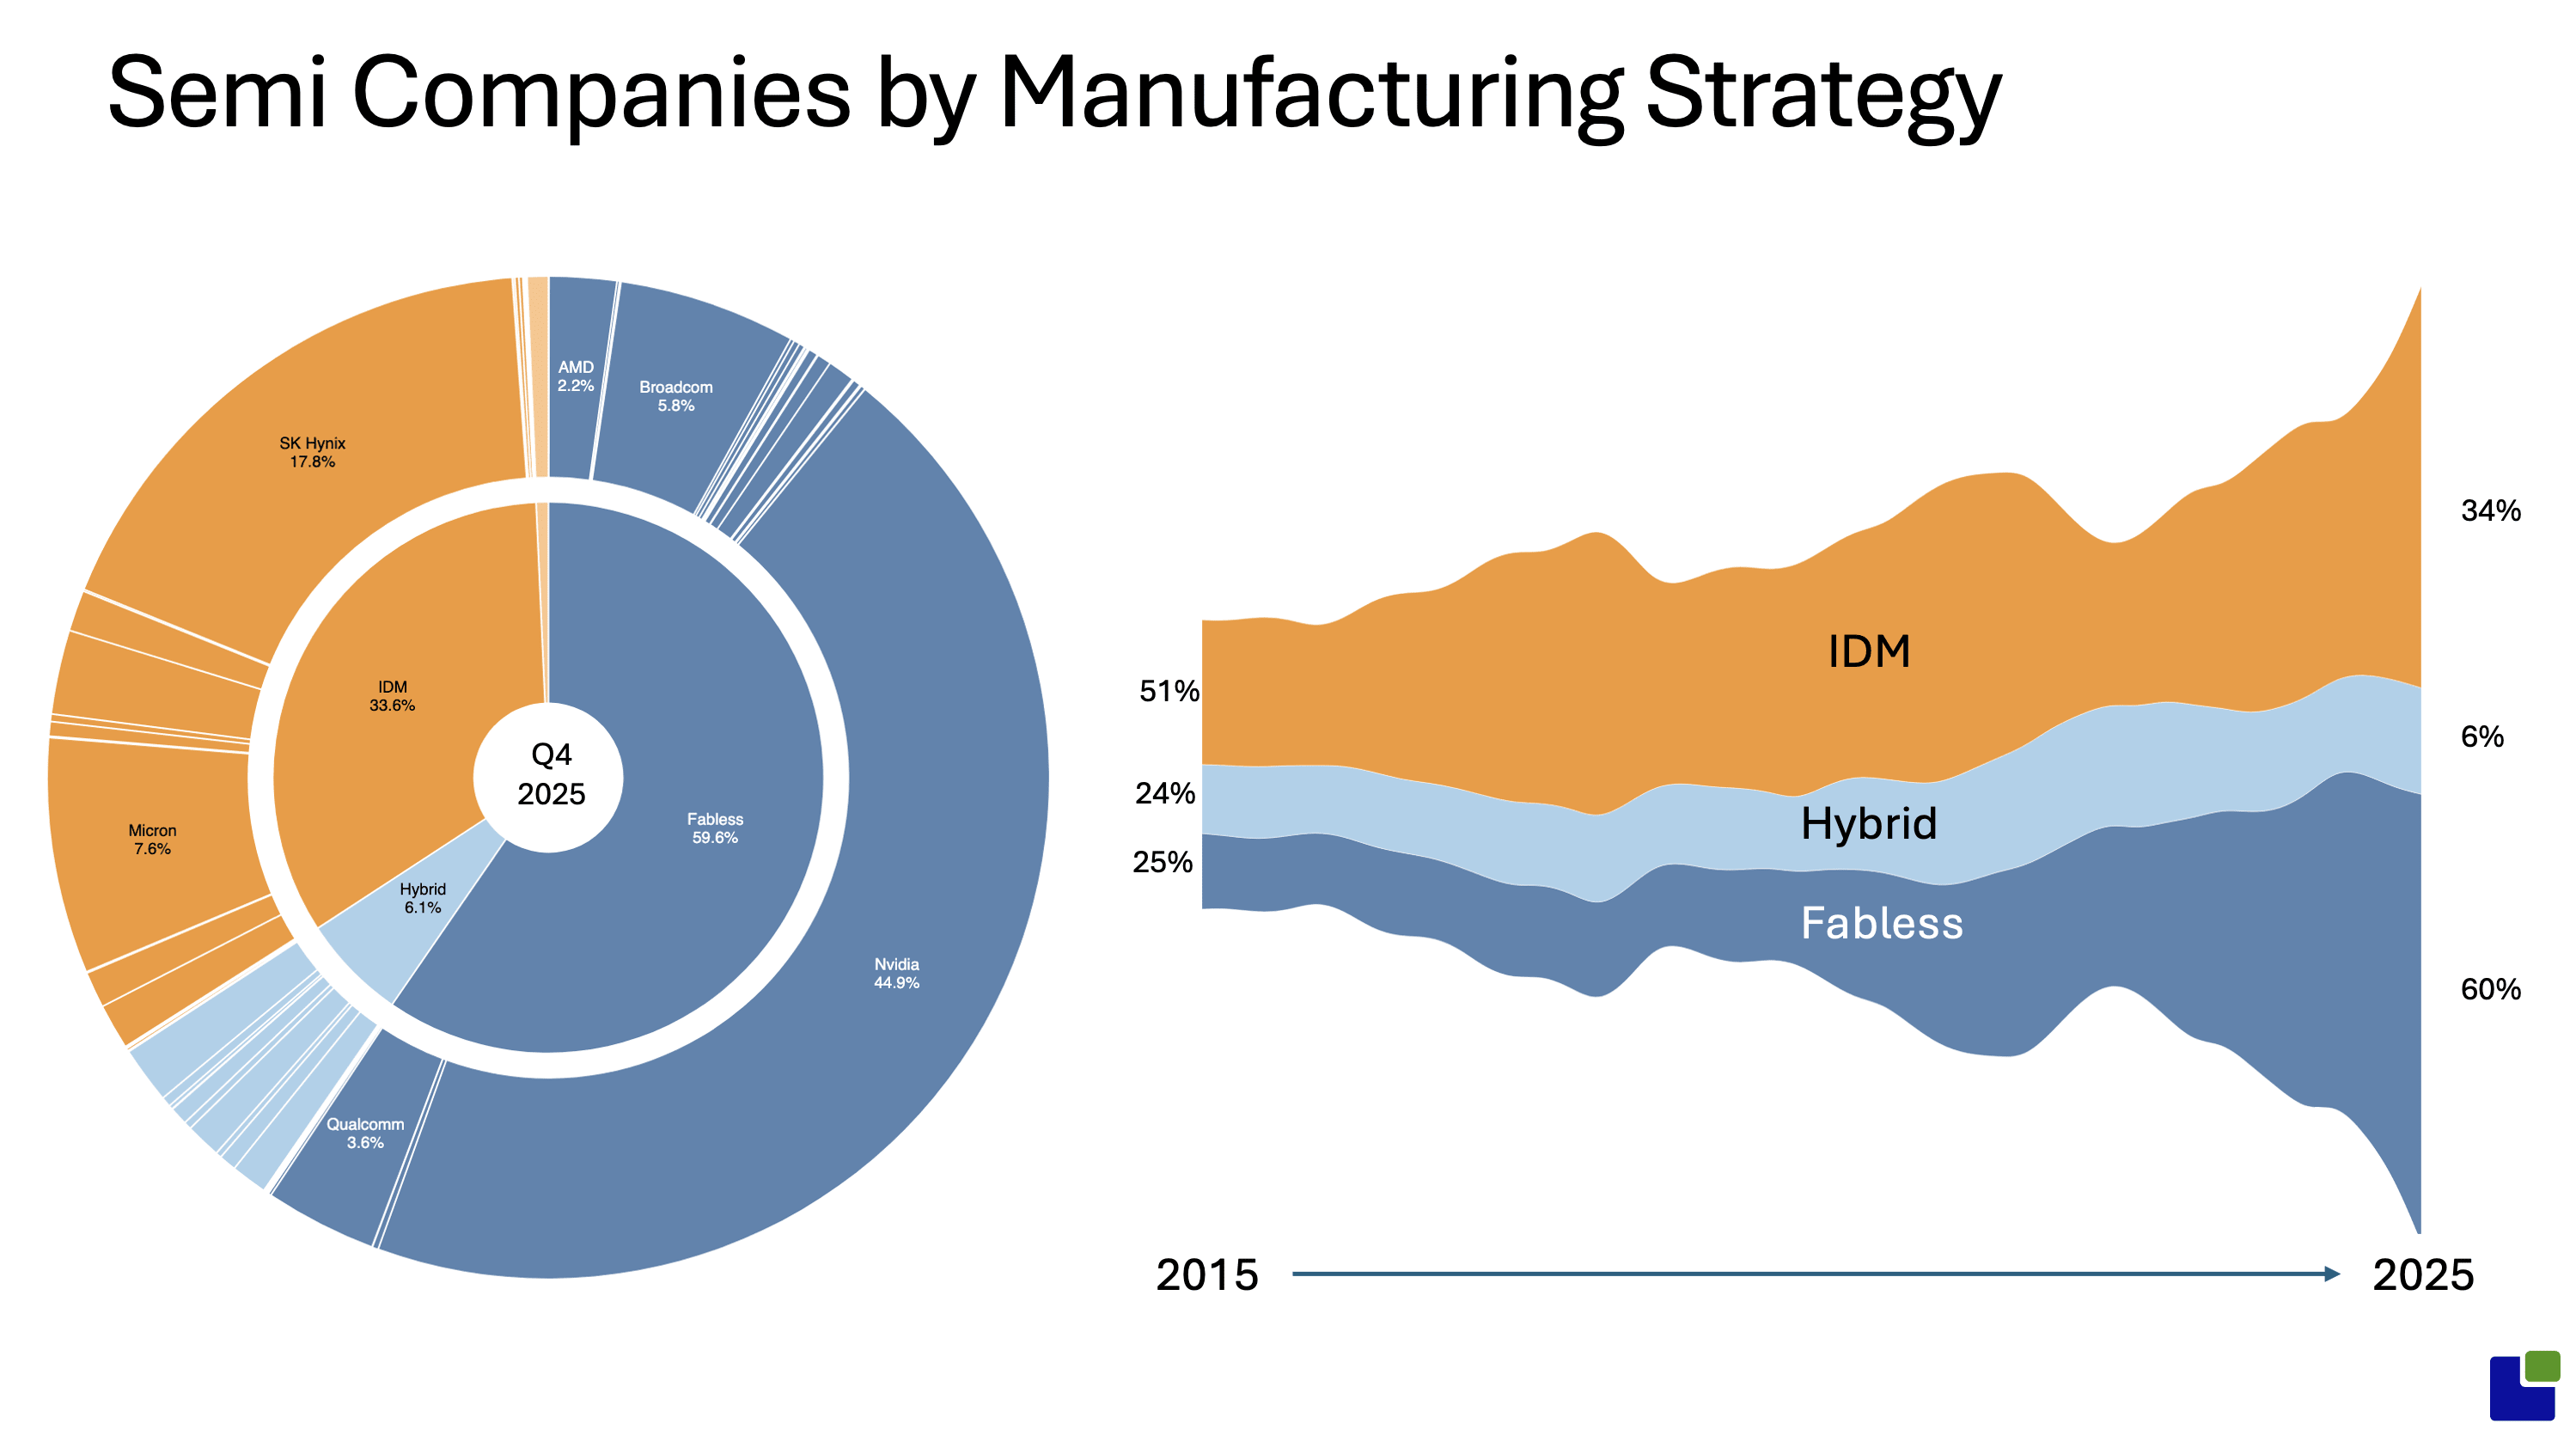
The evolution of the various semiconductor manufacturing models is shown below. From the traditional Integrated Device Manufacturing Model that I grew up with, where the semiconductor company owns everything from design to manufacturing to device sales.
As TSMC emerged as an alternative, many companies chose to skip the difficult and expensive manufacturing process and become fabless.
A group of companies decided to pursue a hybrid model, using their own fabs for power and analogue, while buying logic from the foundries.